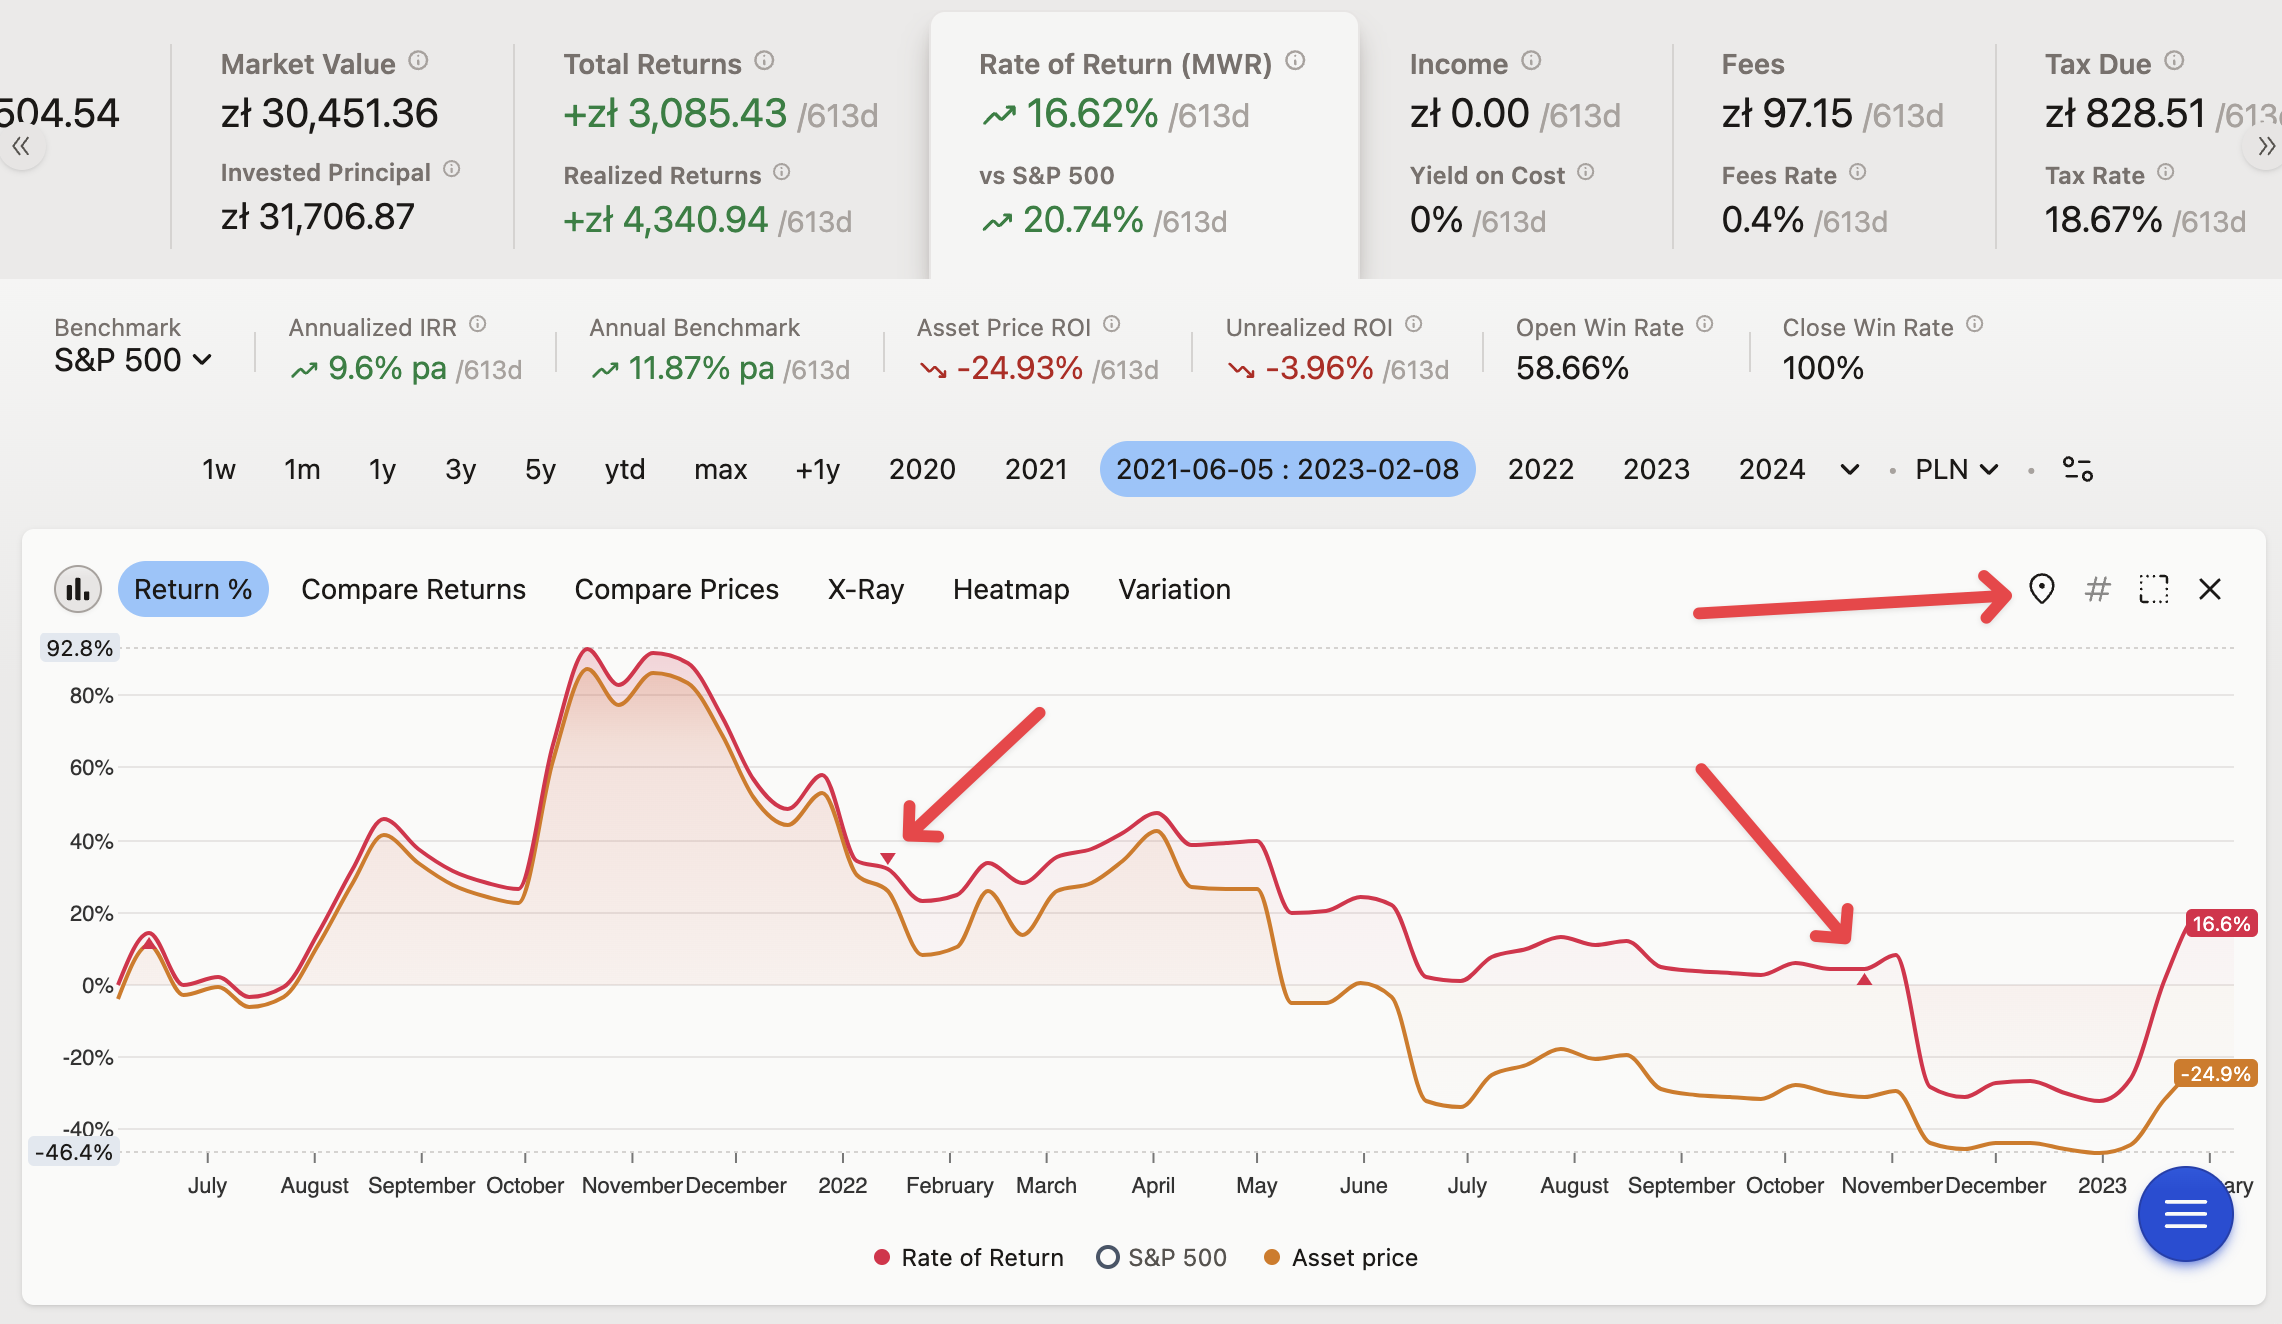
All line charts can display buy/sell/income markers - just toggle them, or open the Transactions view.
It also compares the returns from your actions compared to the price action.
The Price chart does not display any buy/sell markers. It’s more for historical reasons.
Isn’t this what you’re asking for?