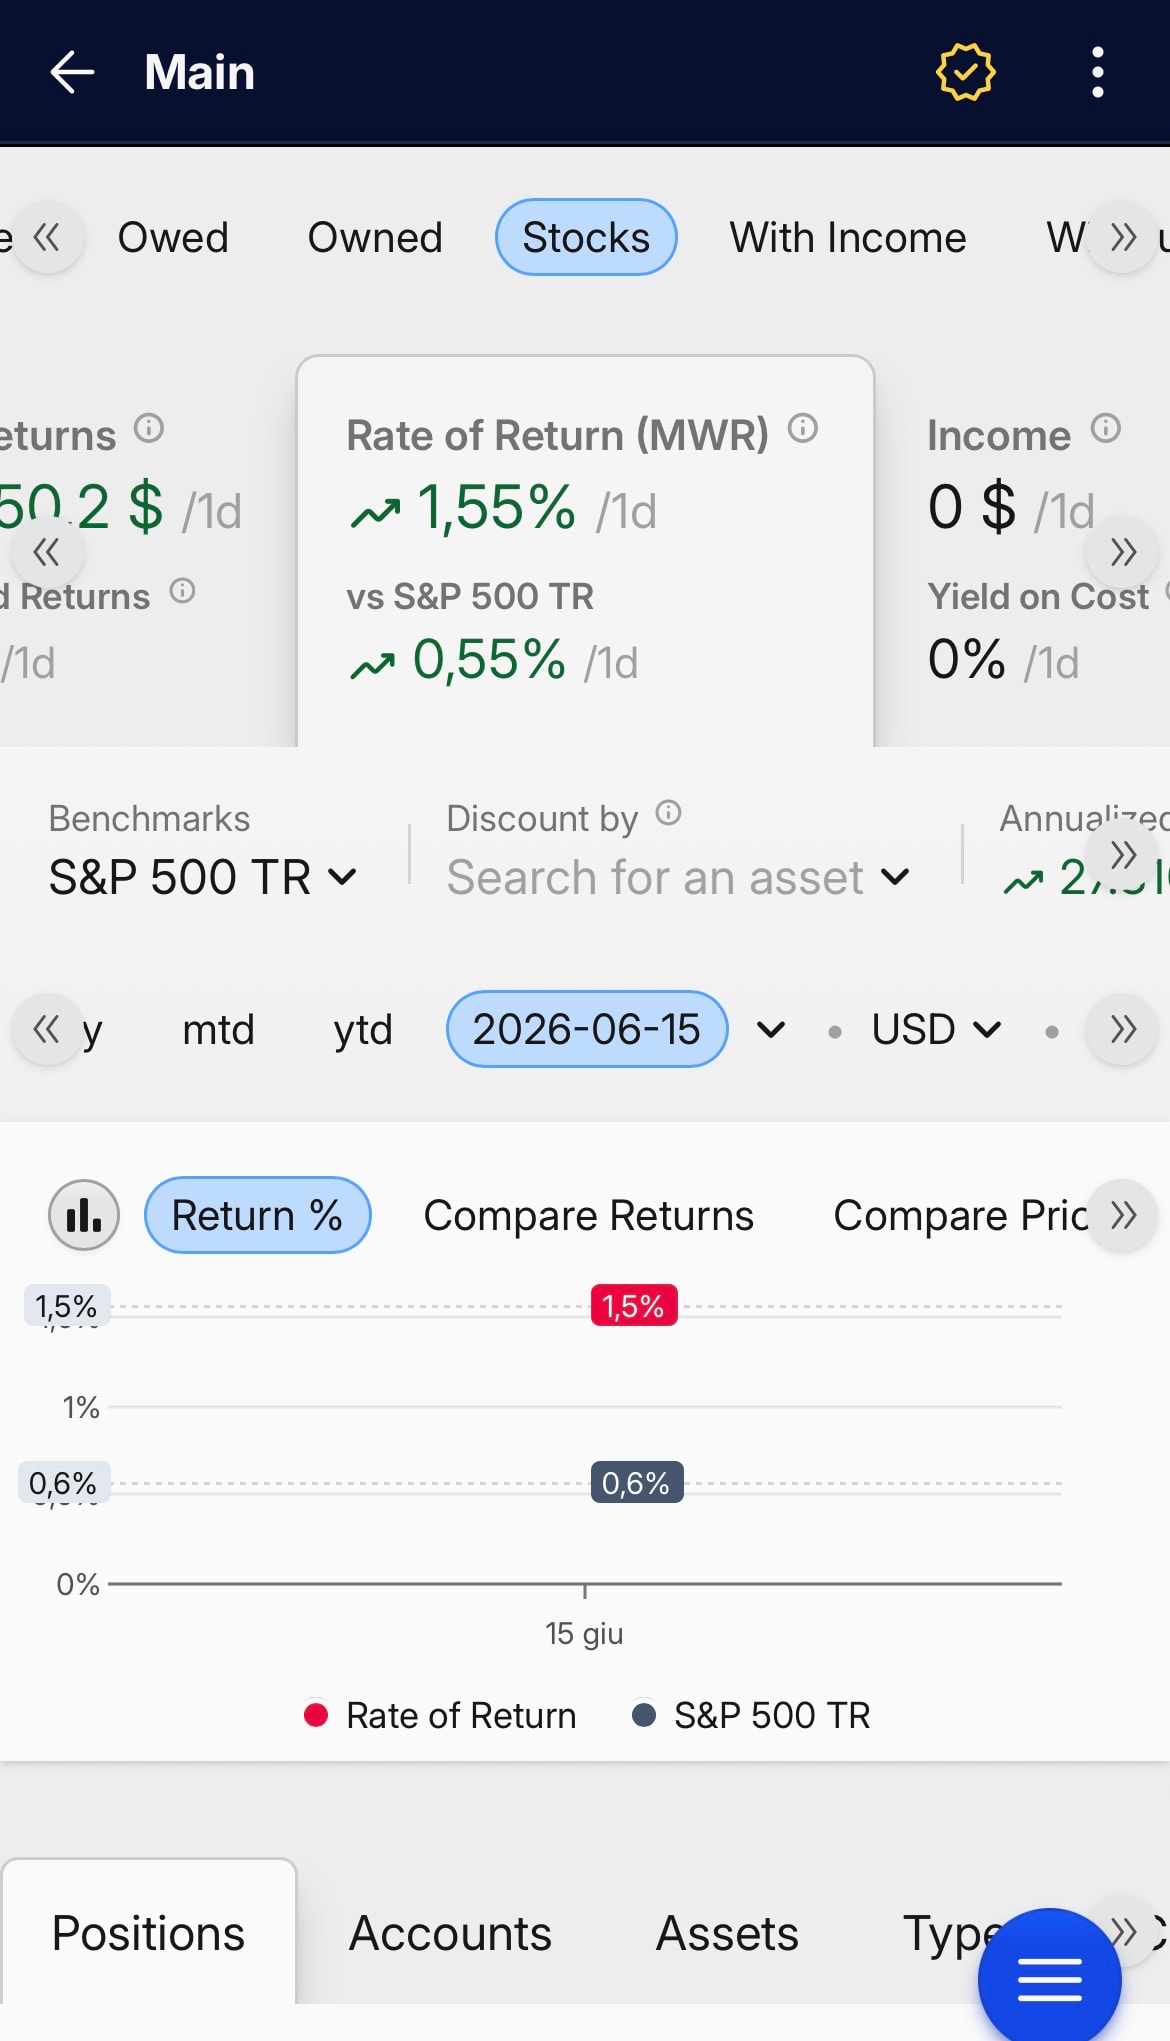
sometimes the benchmarks percentual changes are wrong…on the 15/6 for the SPXTR Index we should have +1,68% and not ++0,55%…
The benchmark % change you see is calculated in your viewing/display currency, not in the benchmark’s native currency. So for an index like SPXTR (priced in USD), the daily change you see also reflects the EUR/USD (or whatever your portfolio currency is) move that day, which is why it can differ from the raw index figure.
What currency are you viewing your portfolio in? That will let me confirm the 15/6 number lines up.
Hi, tks for your answer.
I’m already matching the two currencies (both in usd). Is the performance of the benchmark spread on multiple days i. e. the entire we? Because the data I visualize on monday seems the sum of the previous friday sat. and sunday. Maybe is the %chg not punctually calculated for friday, for other reasons or purposes?
It should not be interpolated - so there are now prices over the weekend. Does the price movement match over a longer period? Can you provide an example including what you’re comparing with?
You’re right, and thanks for staying on this — it turned out to be a genuine bug on our side, not a currency or display-period thing. My earlier guesses were both off, sorry about that.
I checked the numbers: the S&P 500 TR really did gain about +1.68% on Monday 15/6 (vs Friday’s close), and that’s what Capitally should be showing. The +0.55% is wrong.
Your own diagnosis was spot-on — the move is being spread across the weekend. Here’s what’s happening:
A couple of months ago we added gap-filling (interpolation) for index series, so that sparse economic indicators — inflation, GDP, bond yields, which only update monthly or quarterly — draw as smooth continuous lines instead of staircases. That gap-filling draws a straight line between the last known value and the next one.
The problem is that a daily market index like the S&P 500 TR got caught by the same rule. Over a weekend there are no Saturday/Sunday prices, so instead of carrying Friday’s close forward, we now draw a straight line from Friday up to Monday. That smears the Friday→Monday +1.68% jump evenly across Saturday, Sunday and Monday — so each “day” shows roughly a third of it, and Monday on its own lands at ~+0.55%. That’s exactly the figure you saw.
The good news: this only affects the single-day %chg right next to a weekend or holiday. Any multi-day figure — the week, month, YTD, or since-inception return — is still correct, because those compare the real endpoints and the spread-out days add back up to the true total. So benchmark comparisons over any real period aren’t affected; it’s just the day-over-day number around non-trading days.
I’ll switch the daily-priced indices back to carrying the last real price across non-trading days (the macro indicators will keep their smooth interpolation). Thanks again for the clear example and the screenshot — made this easy to pin down.
thank you very much for your precise and rapid answer.
regards
luca
This will be fixed in the next released version.