Currently the charts are pretty limited in customization. It’s great you can quickly switch between the views, but you cannot change them.
The goal here, is to:
- Allow changing the charted metric (e.g. total, capital or currency returns; switching between $ and %)
- Allow changing the grouping (e.g. comparing groups, periods, or groups across periods)
- Allow free choice of chart type
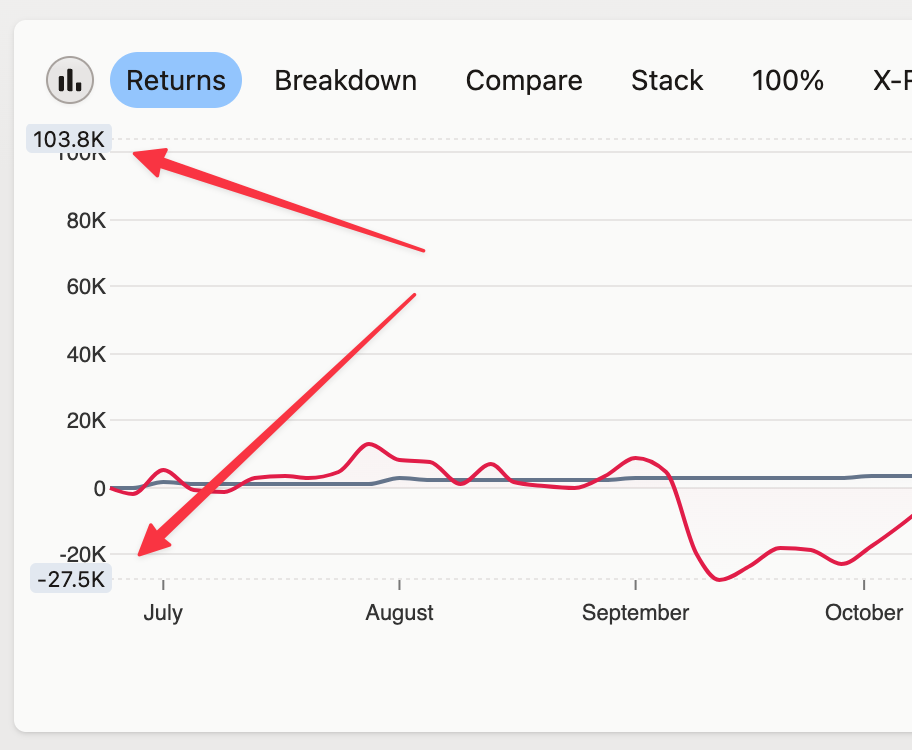
- Add options for some chart types, like whether Line chart should be bound to
0 - Display transaction markers on the line for line charts.
- Display transaction markers in the tooltip for each serie
- Add legend where one can toggle series on/off and choose the number of displayed series for comparison
- Group by positions on the Transactions tab (currently there’s no grouping there at all which is confusing)
- Allow storing chart presets for quick toggling - just like they’re now. Presets would be persisted per metric
Secondary goals (may be introduced separately):
- Donut chart (e.g. for comparing top-level groups)
- Marimekko chart (e.g. for comparing returns relative to allocation)
- Sankey chart (e.g. for comparing types of returns relative to allocation)