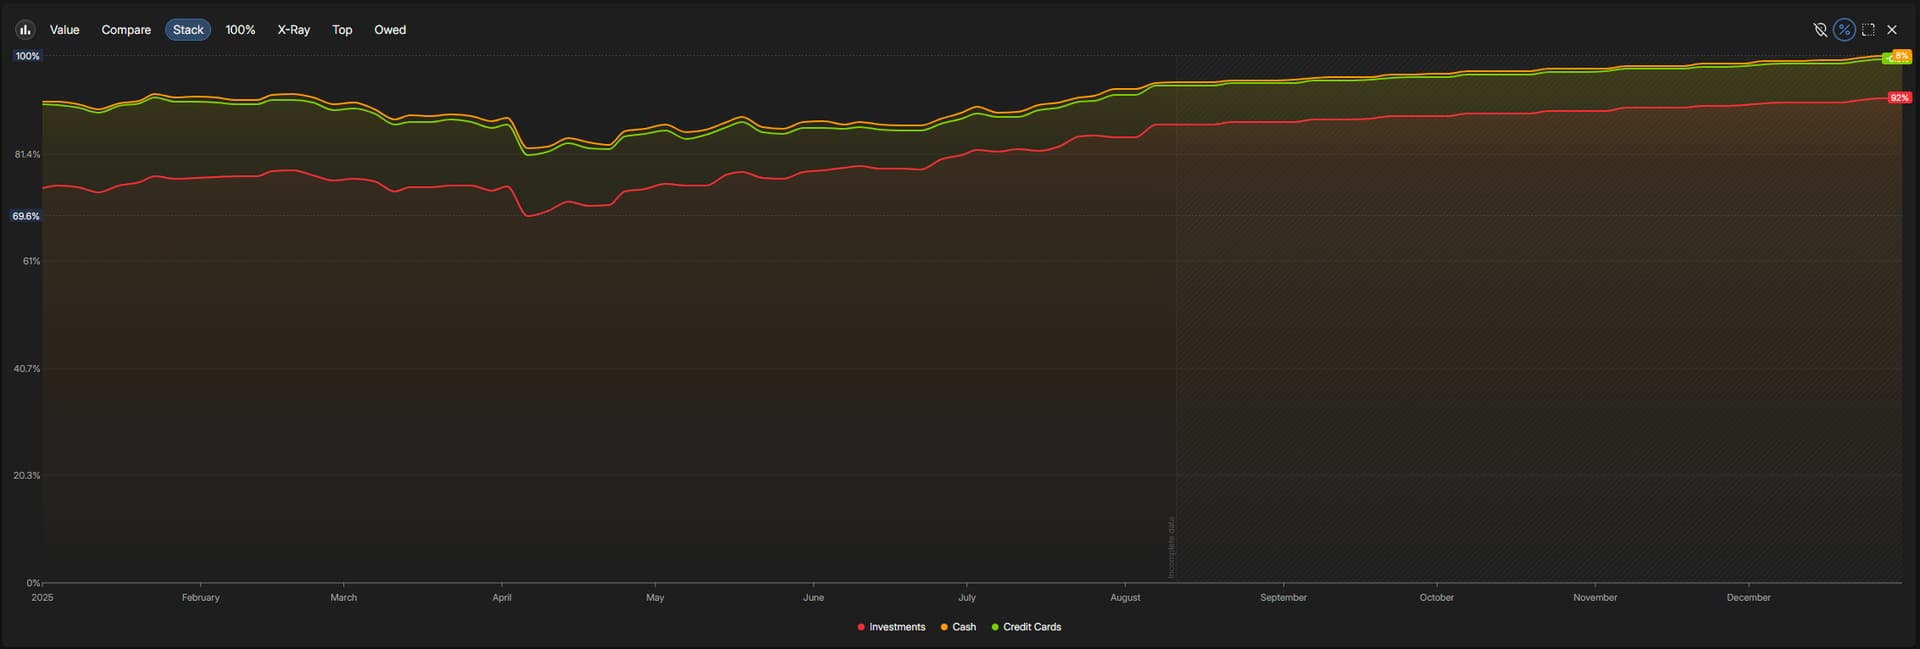
Area graphs like the default “Market Value:Stack” can create confusing output when one of the lines is a liabillity. If the liability line is not added first when creating the stack, the chart ends up showing a higher value on the top than the actual total.
Attached is an example, where the “Credit Cards” line is applied after the two positive account folders.
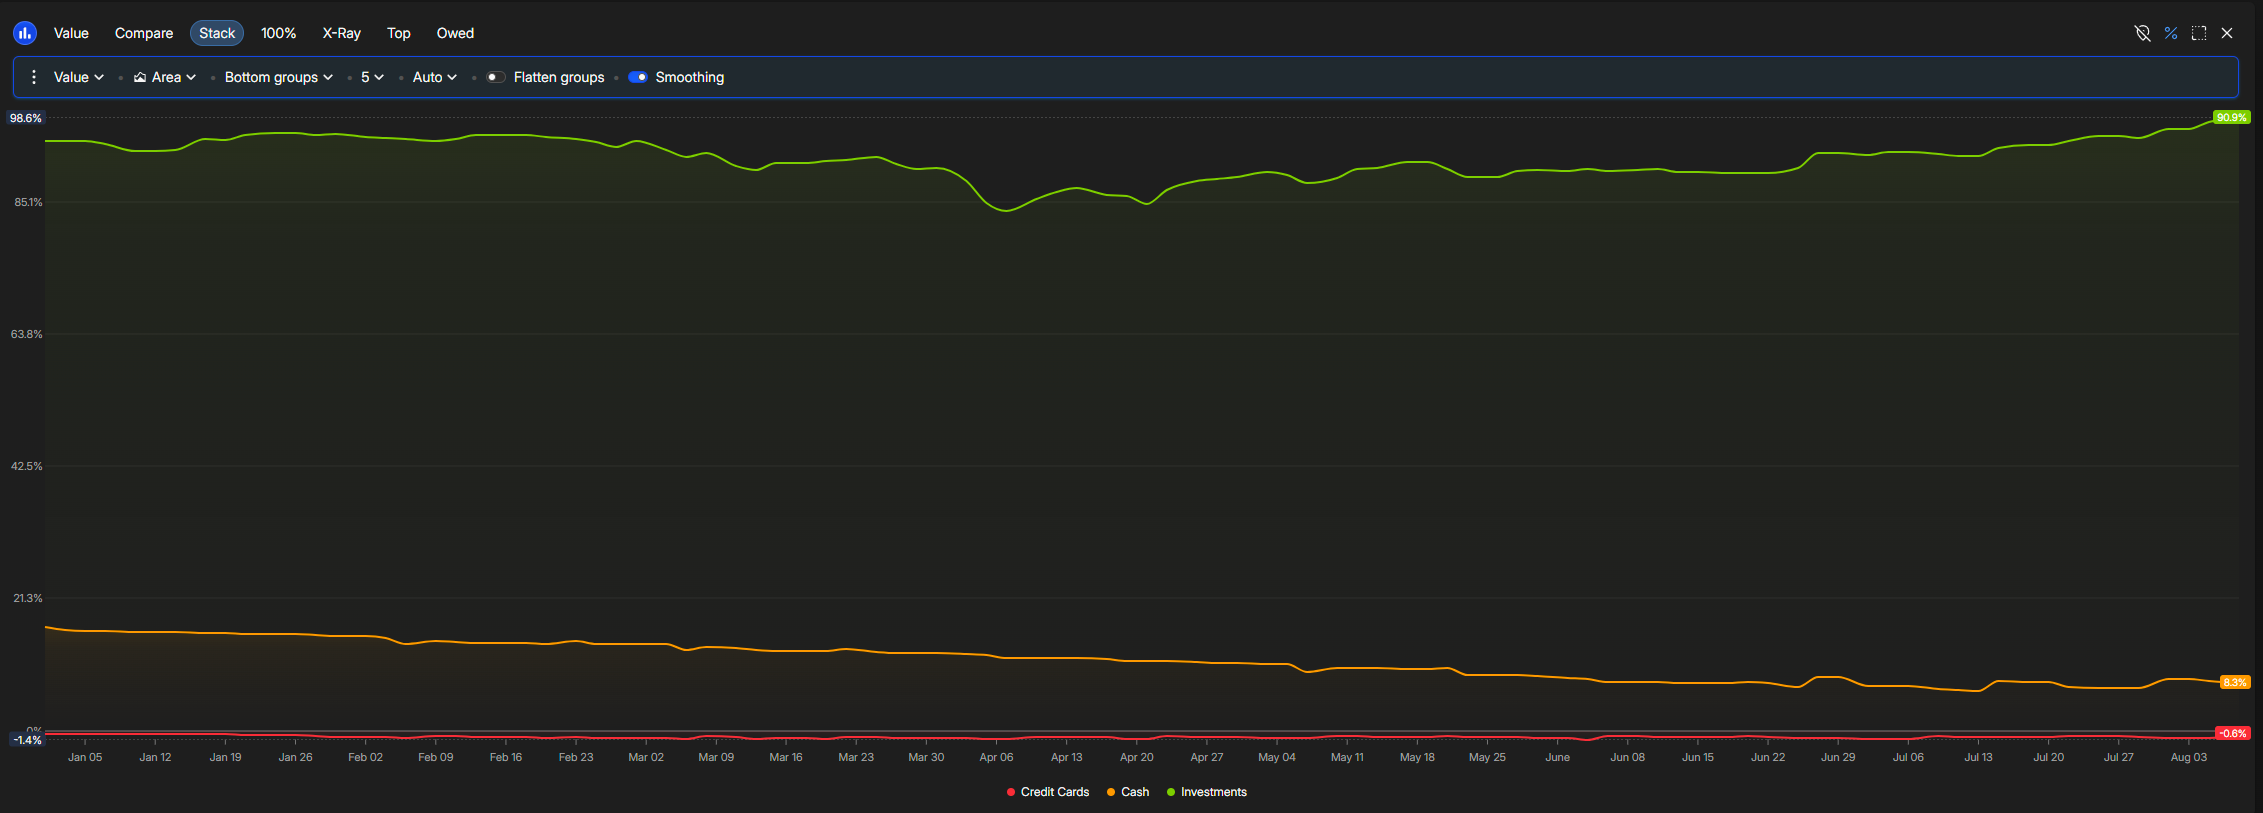
Ideally, liabilities would initially lower the graph, so the overall height matches the sum of the lines.